Do you ever feel like you’re missing out on good chances to make money in the stock market?
Imagine having a tool that not only tells you when to buy or sell but also helps you understand the market better.
Welcome to TradingView—a platform where you can keep an eye on your investments, check out different financial markets, and meet other traders.
Whether you’re just starting or you’ve been trading for a while, TradingView has everything you need to make smarter decisions and catch those big opportunities.
Don’t miss out; see how TradingView can change the way you trade!
🚀 Ready to Trade for Free?
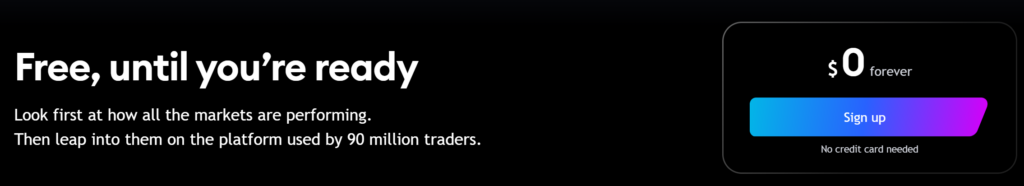
Free, until you’re ready! Start by checking out how all the markets are performing. Then, dive into the action on the platform trusted by 90 million traders.
$0 forever
No credit card needed. Signing up is free!
🤔 How Much TradingView Costs?
📍 Non-Professional

| Details | Essential | Plus | Premium |
|---|---|---|---|
| Monthly Price | $12.95/month | $24.95/month | $49.95/month |
| Annual Price | $155.40/year | $299.40/year | $599.40/year |
| Annual Savings | $24.00 | $60.00 | $120.00 |
| Features | 2 charts per tab, 5 indicators per chart, 10K historical bars, 20 price alerts, 20 technical alerts, 10 parallel chart connections, no ads, volume profile, custom timeframes, custom Range Bars, multiple watchlists, Bar Replay, indicators on indicators, chart data export, intraday Renko, Kagi, Line Break, Point & Figure charts, charts based on custom formulas, Time Price Opportunity, volume footprint, auto chart patterns, second-based alerts, alerts that don’t expire, publishing invite-only scripts… | 4 charts per tab, 10 indicators per chart, 10K historical bars, 100 price alerts, 100 technical alerts, 20 parallel chart connections, no ads, volume profile, custom timeframes, custom Range Bars, multiple watchlists, Bar Replay, indicators on indicators, chart data export, intraday Renko, Kagi, Line Break, Point & Figure charts, charts based on custom formulas, Time Price Opportunity, volume footprint, auto chart patterns, second-based alerts, alerts that don’t expire, publishing invite-only scripts… | 8 charts per tab, 25 indicators per chart, 20K historical bars, 400 price alerts, 400 technical alerts, 50 parallel chart connections, no ads, volume profile, custom timeframes, custom Range Bars, multiple watchlists, Bar Replay, indicators on indicators, chart data export, intraday Renko, Kagi, Line Break, Point & Figure charts, charts based on custom formulas, Time Price Opportunity, volume footprint, auto chart patterns, second-based alerts, alerts that don’t expire, publishing invite-only scripts… |
📍 Professional (Pro)

| Feature | Expert Plan | Ultimate Plan |
|---|---|---|
| Monthly Cost | $199.95 | $499.95 |
| Annual Cost | $2,399.40 | $5,999.40 |
| Annual Savings | $480.00 | $1,200.00 |
| Charts per Tab | 10 | 16 |
| Indicators per Chart | 30 | 50 |
| Historical Bars | 25K | 40K |
| Price Alerts | 600 | 1,000 |
| Technical Alerts | 600 | 1,000 |
| Parallel Chart Connections | 80 | 200 |
| Ads | No ads | No ads |
| Volume Profile | Yes | Yes |
| Custom Timeframes | Yes | Yes |
| Custom Range Bars | Yes | Yes |
| Multiple Watchlists | Yes | Yes |
| Bar Replay | Yes | Yes |
| Indicators on Indicators | Yes | Yes |
| Chart Data Export | Yes | Yes |
| Intraday Renko, Kagi, Line Break, Point & Figure Charts | Yes | Yes |
| Charts Based on Custom Formulas | Yes | Yes |
| Time Price Opportunity | Yes | Yes |
| Volume Footprint | Yes | Yes |
| Auto Chart Patterns | Yes | Yes |
| Second-based Alerts | Yes | Yes |
| Alerts that Don’t Expire | Yes | Yes |
| Publishing Invite-only Scripts | Yes | Yes |
| Second-based Intervals | Yes | Yes |
| Tick-based Intervals (BETA) | Yes | Yes |
| Ability to Buy Professional Market Data | Yes | Yes |
| First Priority Support | Yes | Yes |

➡️ Additional Information:
- 16% off annually (equivalent to approximately 60 days free).
- Sales tax may be added depending on your location due to TradingView, Inc. being registered for sales tax purposes in certain countries.
- Options to start now or get in touch for enterprise solutions are available for both plans.
Quick Links:
🧐 What Makes TradingView Best In The Segment?
📍 Social Networking for Traders
TradingView combines elements of social networking with stock trading. Users can share their trading strategies, charts, and insights with other community members, fostering a collaborative environment that’s unique among trading platforms.
📍 Pine Script
This is TradingView’s built-in scripting language that allows users to create their own custom trading indicators and strategies. Pine Script is relatively easy to learn and enables traders to tailor their tools to their specific trading needs.
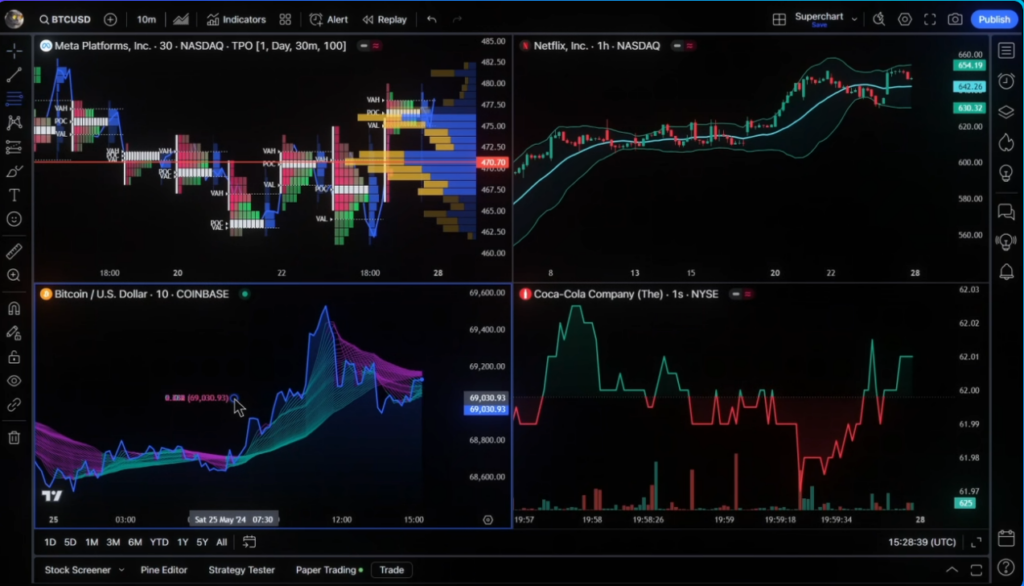
📍 Multi-Timeframe Analysis
TradingView allows users to view multiple timeframes on a single chart simultaneously. This feature is especially useful for traders who want to see long-term trends alongside short-term price actions.
📍 Paper Trading
TradingView features a paper trading simulator, allowing users to practice trading with virtual funds. This feature is perfect for beginners looking to learn without financial risk or for experienced traders testing strategies in a risk-free environment.
📍 Advanced Charting Tools
The platform provides an extensive array of charting tools and technical indicators which are highly customizable, providing traders with the flexibility to configure the charts exactly how they want.
📍 Trading Directly From Charts
Users can execute trades directly from charts without having to navigate away to a separate trading screen. This feature integrates with multiple brokerage platforms and enhances trading efficiency.
📍 Playground Environment
TradingView includes a feature called the “strategy tester,” a kind of playground where traders can back-test strategies using historical data to see how they would have performed.
📍 Public and Private Indicators and Strategies
Users can share their own custom indicators and strategies with the community or keep them private for personal use, adding an element of customization and learning from others.
📍 Heatmaps
TradingView offers market heatmaps, which provide a visual representation of market performance across various sectors and asset classes. These heatmaps help traders quickly identify trends, outliers, and opportunities in the market.
💸 Which Subscription Plan Best Fits Your Needs? Detailed Comparison
</p
Feature Basic Essential Plus Premium Expert Ultimate Signup/Start Sign up Try free Try free Try free Start now Start now Charts per Tab 1 2 4 8 10 16 Saved Chart Layouts 1 5 10 Custom Custom Custom Custom Time Intervals ✔ ✔ ✔ ✔ ✔ ✔ Second-based Intervals ✖ ✖ ✖ ✔ ✔ ✔ Tick-based Intervals (BETA) ✖ ✖ ✖ ✖ ✔ ✔ Intraday Renko, Kagi, Line Break, etc. ✖ ✖ ✔ ✔ ✔ ✔ Custom Range Bars ✖ ✔ ✔ ✔ ✔ ✔ Intraday Charts on Custom Formulas ✖ ✖ ✔ ✔ ✔ ✔ Export Chart Data ✖ ✖ ✔ ✔ ✔ ✔ Customizable Chart Types 17 17 17 21 21 21 Compare Symbols ✔ ✔ ✔ ✔ ✔ ✔ Dividend-adjusted Charts ✔ ✔ ✔ ✔ ✔ ✔ Interactive Earnings, Splits, Dividends ✔ ✔ ✔ ✔ ✔ ✔ Historical Annual Financial Data 7 years 20 years 20 years 20 years 20 years 20 years Historical Quarterly Financial Data 8 years 8 years 8 years 8 years 8 years 8 years Extended Trading Hours ✔ ✔ ✔ ✔ ✔ ✔ Simultaneous Chart Connections 2 10 20 50 80 200 Bar Replay Historical Data by Day and Higher All All All All All All Historical Data by the Minute 42 days 180 days All All All All Historical Data by the Second ✖ ✖ ✖ All ✔ ✔ Indicators Replay ✖ ✖ ✖ ✖ ✔ ✔ Trading in Bar Replay ✖ ✖ ✖ ✖ ✔ ✔ Technical Analysis and Algorithms Indicators per Chart 2 5 10 25 30 50 Financials per Chart 1 4 7 10 15 25 Custom Indicator Templates 1 ✖ ✖ ✖ 110+ 110+ Volume Profile Indicators ✖ ✖ ✖ ✖ ✔ ✔ Time Price Opportunities ✖ ✖ ✖ ✖ ✔ ✔ Volume Footprint ✖ ✖ ✖ ✖ ✔ ✔ Pine Script™ ✖ ✖ ✖ ✖ ✔ ✔ Backtesting for Trading Strategies ✖ ✖ ✖ ✖ ✔ ✔ Export Strategy Data ✖ ✖ ✖ ✖ ✔ ✔ Deep Backtesting ✖ ✖ ✖ ✖ ✔ ✔ Candlestick Patterns Recognition ✖ ✖ ✖ ✖ ✔ ✔ Auto Fib Retracement ✖ ✖ ✖ ✖ ✔ ✔ Multi-timeframe Analysis ✖ ✖ ✖ ✖ ✔ ✔ Time Limit for Calculations 20s 40s 40s 40s 60s 100s Bar Magnifier ✖ ✖ ✖ ✖ ✔ ✔ Auto Chart Patterns ✖ ✖ ✖ ✖ ✔ ✔ Watchlists Symbols per Watchlist 30 1,000 1,000 1,000 1,000 1,000 Alerts Alert Durations 2 mo. 2 mo. 2 mo. ✖ ✖ ✖ Screener ✖ ✖ ✖ ✖ ✔ ✔ Data Export ✖ ✖ ✖ ✖ ✔ ✔ Customer Support Regular Priority Priority First Priority First Priority First Priority
Quick Links:
🔥 Conclusion
The Basic Plan is ideal for beginners exploring charting tools, while the Essential Plan suits casual traders needing basic features. The Plus Plan works for intermediate traders seeking enhanced analysis tools.
Advanced traders and professionals will benefit most from the Premium Plan for in-depth analysis and flexibility. For experts managing complex strategies, the Expert Plan offers unmatched customization, while the Ultimate Plan is perfect for institutional traders requiring extensive features and support.
Recommendation: If you’re starting out, the Plus Plan balances cost and functionality well. For serious traders, the Expert Plan provides robust tools.
Institutional or heavy users should consider the Ultimate Plan for its unparalleled capabilities. Choose based on your trading needs and goals!